Introduction To Performance
The Concepts of Parallel Performance
Parallel computing used to be a very specialized domain; but now even making the best use of your laptop, which almost certainly has multiple independant computing cores, requires understanding the basic concepts of performance in a parallel environment.
Most fundamentally, parallel programming allows three possible ways of getting more and better science done:
- Running your computation many times
- If you have a program that works in serial, having many processors available to you allows you to run many copies of the same program at once, improving your throughput. This (can be) a sort of trivial use of parallel computing and doesn't require very specialized hardware, but it can be extremely useful for, for instance, running parameter studies or sensitivity studies. Best of all, this is essentially guaranteed to run efficiently if your serial code runs efficiently! Since this doesn't require fancy hardware, it should run fine on niagara.
- Running your computation faster
- This is what most people think of as parallel computing. It can take a lot of work to make an existing code run efficiently on many processors, or to design a new code to make use of these resources, but when it works, one can achieve a substantial speedup of individual jobs. This might mean the difference between a computation running in a feasible length of time for a research project or taking years to complete --- so while it may be a lot of work, it may be your only option. To determine whether your code runs well on many processors, you need to measure speedup and efficiency; to see how many processors one should use for a given problem you must run strong scaling tests.
- Running your computation on larger problems
- One achieves speedup by using more processors on the same problem. But by running your job in parallel you may have access to more resources other than just processors --- for instance, more memory, or more disks. In this case, you may be able to run problems that simply wouldn't be possible on a single processor or a single computer; one can achieve significant sizeup. To find how large a problem one can efficiently run, one measures efficiency and runs weak scaling tests.
Of course, these aren't exclusive; one can take advantage of any combination of the above. It may be that your problem runs efficiently on 8 cores but no more; however, you may be able to get use of more processors by running many jobs to explore parameter space, and already on 8 cores you may be able to consider larger problems than you can with just one!
Throughput
Throughput is the most fundamental measure of performance, and the one that ultimately most matters to most computational scientists -- if you have N computations that you need to have done for your research project, how quickly can you get them done? Everything else we'll consider here is just a way of increasing throughput T:
If you have many indepdendent computations to perform (such as a parameter study or a sensitivity study) you can increase throughput almost arbitrarily by running them alongside each other at the same time, limited only by the number of processors available (or the wait time in the queue, or the disk space available, or some other external resource constraint). This approach obviously doesn't work if you only have one computation to perform, or if later computations require the output from previous ones. In these cases, or when the individual jobs take infeasibly long, or cannot be performed on only one processor, one must resort to also using parallel programming techniques to parallelize the individual jobs.
Compute Time
Fundamental to everything else that follows is measuring the amount of time a computation takes on some problem size/amount of work and some number of processors . We'll denote this by . The easiest way to measure this time is with the time command that comes on most flavours of Unix in /bin/time or /usr/bin/time:
/bin/time myprogram
...normal program output...
658.44user 0.85system 10:59.41elapsed
The format of the times output at the end may vary from system to system, but the basic information returned will be the same. The real or elapsed time listed is the actual Wallclock time that elapsed during the run, user or cpu is the CPU time that was actually spent doing your computation, and the system time is the system time that was spent doing system-related things during the run, such as waiting for file input/output. Our goal will be to reduce the real wallclock time that the simulation takes as much as possible while still making efficient use of the resources available.
Parallel Speedup
The speedup of an individual job with some amount of work as you go from some running it serially to running on is simply:
That is, the time it takes to run the computation on P vs on one processor. The way this is usually done is to run the parallel code on and on processor and take the ratio of the two times; but this is a form of cheating, as the parallel version of the code will generally have overheads (even in the one-processor case) compared to the best available serial-only version of the code. The best thing to do in considering the efficiency of the parallelization to compare the parallel code to the best available serial code that does the same job.
If you are considering the speedup of a problem that doesn't fit onto one processor, of course, the concept of speedup can be generalized; one needn't start at .
It should go without saying that, while developing your parallel code and during performance tuning, you get the same results with multiple processors as with some `known good' serial test case; it is even easier to introduce bugs in parallel code than it is in serial code!
Efficiency
Once you have a parallel code and some timing results one can look at how efficiently you are making use of the resources as you use more and more processors. The parallel efficiency of a computation of some fixed work size running on processors as compared to the case is
That is, if you get a speedup of in going from one to eight processors, you are at 1.00 or 100% efficiency; anything less and you are at lower efficiency. It isn't uncommon to achieve greater than 100% parallel efficiencies for small numbers of processors for some types of problems; as you go to more processors, you also have more processor cache, and thus more of the problems data can fit into fast cache. This is called super-linear speedup and sadly seldom extends out to very many processors.
Strong Scaling Tests
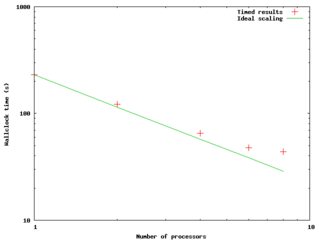
The figure to the right and data below shows an example of a result of a small strong scaling test --- running a fixed-size problem on a varying number of processors to see how the timing of the computation scales with the number of processors. The code was an OpenMP code run on a node of SciNet's now-decomissioned workhorse, the GPC. The quantitative results follow below; the times were measured and then speedups and efficiencies were calculated as above.
| P | t(N,P) | S(N,P) | E(N,P) |
|---|---|---|---|
| 1 | 3:50 | - | - |
| 2 | 2:02 | 1.87x | 94 % |
| 4 | 1:05 | 3.52x | 88 % |
| 6 | 47.8 | 4.81x | 80 % |
| 8 | 43.6 | 5.28x | 66% |
The plot shows the compute time as a function of P; if the code maintained 100% parallel efficiency, we would expect the scaling to be as 1/P, so we plot it on a log-log scale. Also shown is the ideal scaling case -- what the times would be if, using the timing as a normalization, we did get 100% efficiency. We can see that past 4 cores the measured case starts to significantly deviate from the ideal, and it looks like things would only get worse past 8 cores.
It's important to note here that scaling tests should be done on realistic problem sizes and for realistic lengths of time. Generally, for either serial or parallel programs there will be some overhead both at initialization time and during the course of the computation; if the problem size is too small, the overhead during the course of the run might be a significant fraction of the real work, and the program will behave needlessly poorly. Similarly, if the number of timesteps or iterations is too small, the initizalization overhead will similarly play a spuriously large role in the performance.
The above behaviour is typical for a small computation; it won't scale to too many cores, and the efficiency becomes monotonically worse as one increases the number of cores in use. The rate at which this happens will depend on the problem size and the type of computation. How is one to tell where to stop; how good an efficiency is good enough? Certainly there are rules of thumb --- one shudders to see efficiencies below 50% --- but one can arrive at more meaningful and quantitative results by considering throughput. Let's imagine we had 64 cores at our disposal, and we wanted to run 96 jobs as quickly as possible. Our total time to completion of the 96 jobs would vary with the number of cores we ran per job as follows:
| P | Time for one job | Time for all 96 jobs |
|---|---|---|
| 1 | 3:50 | 7:40 (2 batches, 64 jobs then 32) |
| 2 | 2:02 | 7:08 (3 batches, 32,32,32) |
| 4 | 1:05 | 6:30 (6 batches, 6x16) |
| 6 | 47.8 | 7:58 (10 batches, 9x10, 6) |
| 8 | 43.6 | 8:43 (12 batches) |
If we use more than 4 processes per job in this case, it will actually take us longer to do all our runs! For jobs that scale better with the number of processes (this could be a different program, or the same program with different problem size), we will find this turnover point to be at higher ; for jobs that scale worse, lower .
Weak Scaling Tests
The strong scaling test described above considers the performance of a parallel code with a fixed work size as the number of processors varies; this tells us how the parallel overhead behaves as you go to more and more processors. A weak scaling test fixes the amount of work per processor and compares the execution time over number of processors. Since each processor has the same amount to do, in the ideal case the execution time should remain constant. While the strong scaling test tells you how the parallel overhead scales with , the weak scaling test tells you something weaker -- whether the parallel overhead varies faster or slower than the amount of work.
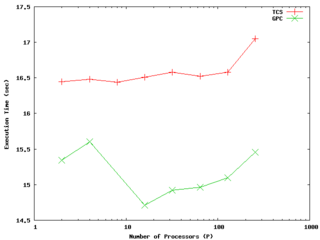
Nonetheless, the weak scaling test can be the relevant one for determining how large a problem size one can efficiently compute with a given parallel code and system. An example of results for a weak scaling test on the now-decommissioned GPC and TCS, up to 256 processors (8 nodes of the TCS, 32 of the GPC), is shown to the right. In this case we are maintaining extremely good efficiency up to at least 128 processors with constant work per process on both architectures. It is possible to see different behaviour when first filling up a node (eg, for less than 8 processes for the GPC, or 64 for TCS) than when one starts crossing nodes; one should understand this but it doesn't necessarily indicate problems.
Performance Tuning
You cannot improve what you cannot measure. Performance tuning is an iterative process between running an instrumented version of your code, getting data on performance throughout the code, and attempting to make chances to the code that will make it run more efficiently.
There are three main ways of instrumenting a code to find its performance. The first is manually adding timers around important parts of the code to find out how much time is spent in each part. This is worth thinking about doing when putting together a new code, as it means that you'll have a very robust way of finding out how well the different parts of the code perform on different platforms and with different compiler options, etc.. The results are, however, necessarily very coarse-grained; they are very useful for comparing performance under different situations, but give very little information about whether or not there are performance problems or what they might be.
The second technique is sampling, sometimes called `program counter sampling' or `statistical sampling'. In this case, the program is run in an environment where it is interrupted briefly at some set frequency (typically something like 100 times per second) and the location of the program counter is jotted down before the program is resumed. At the end of the program, these locations are translated into locations in the source code, and one has a statistical profile of where the program has spent its time.
Statistical sampling has several advantages. It has a very low overhead --- the sampling procedure for instance takes much less time than a function call to a timer routine --- so that the program runs much as it would without the measurement process. If the samples are taken often enough, the result is a very accurate picture of where your program is spending its time, allowing you to very quickly identify `hotspots' in the code and focus your attention on the most costly areas of the program. This combination of relevant information and low-overhead makes statistical sampling the first resort for serious performance measurement.
Sampling, however, has drawbacks. While it lets you know where the program is spending its time, it doesn't tell you why, or how it got there in the first place. For instance, in a parallel program you may be spending too much time in barriers of one sort or another (perhaps at MPI_WAITALL calls in MPI, or implicit barriers at the end of parallel sections in OpenMP) but unless you know where in the code that routine was called from, you can't address the problem. In this case you need some sort of trace through the program which keeps track of which routine called what. This is generally a much heavier-weight process, which can substantially increase the runtime of the code, running the risk of 'the Heisenburg effect' - measurement changing the system under observation. On the other hand, sometimes you just need that level of information, so tracing packages or libraries must be used.
Simple Timer Wrappers: C, FORTRAN
Below are some simple examples of timers in C and FORTAN which can be called before and after blocks of code to give wallclock times (in seconds) to give coarse-grained timings for sections of your code. Other approaches are possible.
Simple timers in C:
void tick(struct timeval *t) {
    gettimeofday(t, NULL);
}

/* returns time in seconds from now to time described by t */
double tock(struct timeval *t) {
    struct timeval now;
    gettimeofday(&now, NULL);
    return (double)(now.tv_sec - t->tv_sec) + ((double)(now.tv_usec - t->tv_usec)/1000000.);
}
and how to use them:
#include <sys/time.h>
struct timeval init, calc, io;
double inittime, calctime, iotime;

    /*... */


tick(&init);
/* do initialization */
inittime = tock(&init);


tick(&calc);
/* do big computation */
calctime = tock(&calc);

tick(&io);
/* do IO */
iotime = tock(&io);

printf("Timing summary:\n\tInit: %8.5f sec\n\tCalc: %8.5f sec\n\tI/O : %8.5f sec\n",
        inittime, calctime, iotime);
Simple timers in FORTRAN:
subroutine tick(t)
    integer, intent(OUT) :: t

    call system_clock(t)
end subroutine tick

! returns time in seconds from now to time described by t
real function tock(t)
    integer, intent(in) :: t
    integer :: now, clock_rate

    call system_clock(now,clock_rate)

    tock = real(now - t)/real(clock_rate)
end function tock
And using them:
 call tick(calc)
!  do big calculation
 calctime = tock(calc)

 print *,'Timing summary'
 print *,'Calc: ', calctime
Command-line Performance Tools
Many of the tools below can be used to examine both serial and parallel performance problems with a code. We'd like to encourage you to tune serial performance first. Worrying about parallel performance before the code performs well with a single task doesn't make much sense! Profiling your code when running with one task allows you to spot serial `hot spots' for optimization, as well as giving you more detailed understanding of where your program spends its time. Further, any performance you make in the serial code will automatically speed up your parallel code.
We've already talked about coarse-grained measurements such as timers within the code and using tools such as /bin/time. These are very useful for comparing overall performance between different platforms/parameters, but we won't need to discuss them further here.
gprof
A statistical sampling workhorse is gprof, the GNU version of an old common Unix utility called prof. To use this, the code must be re-compiled with both source-code symbols intact (-g) and with profiling information available (for most compilers, this is -pg; for the IBM compilers (xlf, xlc, xlC) it is -p). It is worth knowing because of its ubiquity, and because it contains much of the functionality of newer tools so that the same concepts occur in other concepts.
So let's consider the following trivial program pi.c:
#include <stdio.h>
#include <stdlib.h>
#include <time.h>

double calc_pi(long n) {
    long in = 0;
    long out = 0;
    long i;
    double x,y;

    for (i=0; i<n; i++) {
        x = drand48();
        y = drand48();
        if (x*x+y*y < 1) {
            in++;
        } else {
            out++;
        }
    }

    return 4.*(double)in/(double)(in+out);
}

int main(int argc, char **argv) {
    long n, defaultn=100000;
    double pi;
    time_t t;

    /* seed random number generator */
    srand48(time(&t));

    /* get number of tries */
    if (argc < 2 || (n=atoi(argv[1]))<1) {
        n = defaultn;
        printf("Using default n = %ld\n", n);
    }

    pi = calc_pi(n);
    printf("Pi = %lf\n", pi);

    return 0;
}
We can compile this with profiling on and run it:
$ gcc -g -pg -o pi pi.c
$ ./pi 100000000
Pi = 3.141804
(Note that this isn't a very good way of calculating pi!). On exit, this program creates a file called gmon.out; this contains the profiling information about the run of the code. We can take a look at this by using gprof:
$ gprof pi gmon.out
Flat profile:

Each sample counts as 0.01 seconds.
  %   cumulative   self              self     total
 time   seconds   seconds    calls  ms/call  ms/call  name
100.88      1.00     1.00        1   998.76   998.76  calc_pi

index % time    self  children    called     name
                1.00    0.00       1/1           main [2]
[1]    100.0    1.00    0.00       1         calc_pi [1]
-----------------------------------------------
                                                 <spontaneous>
[2]    100.0    0.00    1.00                 main [2]
                1.00    0.00       1/1           calc_pi [1]
-----------------------------------------------
The first part tells us that essentially all of the time spent running was in the calc_pi() routine (of course), and the second part attepts to be a call graph, showing that main called calc_pi() once. An important concept in the timing is the `self' and `children' times for each routine, sometimes called the inclusive and exclusive time. Because most routines call many other routines, its often useful to distinguish between the total amount of time spent between starting and ending the routine (the `inclusive' time) and that same time excluding the time spent in child routines (`exclusive' time).
The above results are fairly trivial and not very useful for this simple program, but in more complicated routines it can be very valuable to narrow down hotspots to particular regions of code.
In fact, gprof also allows you to view the time spent in the code by lines of code. As you chop the program up finer, the statistical sampling gets less accurate; thus to look at the results by line of code you must be sure that your sample run was long enough to get meaningful data. But the results can be extremely useful:
$ gprof --line pi gmon.out
Flat profile:

Each sample counts as 0.01 seconds.
  %   cumulative   self              self     total
 time   seconds   seconds    calls  Ts/call  Ts/call  name
 70.31      0.70     0.70                             calc_pi (pi.c:14 @ 40078b)
 14.27      0.84     0.14                             calc_pi (pi.c:17 @ 4007bc)
  5.10      0.89     0.05                             calc_pi (pi.c:11 @ 4007c1)
  4.08      0.93     0.04                             calc_pi (pi.c:15 @ 4007b5)
  3.06      0.96     0.03                             calc_pi (pi.c:13 @ 400781)
  2.55      0.98     0.03                             calc_pi (pi.c:12 @ 400777)
  1.53      1.00     0.02                             calc_pi (pi.c:11 @ 40076d)
  0.00      1.00     0.00        1     0.00     0.00  calc_pi (pi.c:5 @ 40074c)
where now we can see that the single line containing the radius calculation (if (x*x+y*y < 1)) is 70% of the work for the entire program. This tells you where you should spend your time to optimize the code. Other tools exist for this sort of line-by-line analysis; gcov in the gcc compiler suite counts the number of times a given source line is executed - the idea was for coverage analysis for test suites, but it certainly can be used for profiling as well; however, usually the amount of time spent at a line is more important than the number of executions.
For parallel programs, gprof will generally output a seperate gmon.out file for each process; for threaded applications, output for all threads will be summed into the same gmon.out. It may be useful to sum up all the results and view them with gprof or to look at them individually.
cachegrind (Memory use analysis)
valgrind is a memory tool that is usually thought of in terms of finding memory-access bugs in large programs. Rather than instrumenting a code or measuring counters, valgrind takes a fairly extreme approach -- it emulates your program running on a computer, essentially running a simulation of your program running on the same kind of computer valgrind is running on. This has enormous overhead (runtimes can be up to 20x as long as normal) but the result is exquisitely detailed information about what your program is doing.
Memory access is often a bottleneck for HPC codes, and cachegrind is a tool for valgrind which simulates the use of cache in your program, giving you line-by-line information on which parts of the code have cache performance issues. Your code does not need to be recompiled, although compiling with -g is necessary for the output to be useful. Cachegrind is run as shown:
valgrind --tool=cachegrind myprogram myprogram_arguments
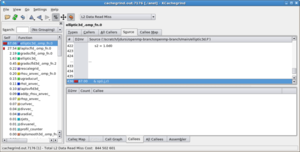
Overall results for the whole program are given at the end of the programs normal output, and more detailed information is saved in a file that begins with cachegrind.out. These output files are XML files - readable in principle by humans, but it is much easier to see what is going on with visual tools like kcachegrind (shown to the right) or, eventually, valkyrie (which also can be used for memcheck output.)


