Parallel Debugging with DDT
ARM DDT Parallel Debugger
For parallel debugging, SciNet has DDT ("Distributed Debugging Tool") installed on all our clusters. DDT is a powerful, GUI-based commercial debugger by ARM (formerly by Allinea). It supports the programming languages C, C++, and Fortran, and the parallel programming paradigms MPI, OpenMPI, and CUDA. DDT can also be very useful for serial programs. DDT provides a nice, intuitive graphical user interface. It does need graphics support, so make sure to use the '-X' or '-Y' arguments to your ssh commands, so that X11 graphics can find its way back to your screen ("X forwarding").
The most currently installed version of ddt on Niagara is DDT 19.1. The ddt license allows up to a total of 128 processes to be debugged simultaneously (shared among all users).
To use ddt, ssh in with X forwarding enabled, load your usual compiler and mpi modules, compile your code with '-g' and load the module
module load ddt
You can then start ddt with one of the following commands:
ddt
ddt <executable compiled with -g flag>
ddt <executable compiled with -g flag> <arguments>
ddt -n <numprocs> <executable compiled with -g flag> <arguments>
The first time you run DDT, it will set up configuration files. It puts these in the hidden directory $SCRATCH/.allinea.
Note that most users will debug on the login nodes of the a clusters (nia-login0{1-3,5-7}), but that this is only appropriate if the number of mpi processes and threads is small, and the memory usage is not too large. If your debugging requires more resources, you should run it through the queue. On Niagara, an interactive debug session will suit most debugging purposes.
ARM MAP Parallel Profiler
MAP is a parallel (MPI) performance analyser with a graphical interface. It is part of the same DDT module, so you need to load ddt to use MAP (together, DDT and MAP form the ARM Forge bundel).
It has a similar job startup interface as DDT.
To be more precise, MAP is a sampling profiler with adaptive sampling rates to keep the data volumes collected under control. Samples are aggregated at all levels to preserve key features of a run without drowning in data. A folding code and stack viewer allows you to zoom into time spent on individual lines and draw back to see the big picture across nests of routines. MAP measures memory usage, floating-point calculations, MPI usage, as well as I/O.
The maximum number of MPI processes for that our MAP license supports is 64 (simultaneously shared among all users).
It supports both interactive and batch modes for gathering profile data.
Interactive profiling with MAP
Startup is much the same as for DDT:
map
map <executable compiled with -g flag>
map <executable compiled with -g flag> <arguments>
map -n <numprocs> <executable compiled with -g flag> <arguments>
After you have started the code and it has run to completion, MAP will show the results. It will also save these results in a file with the extension .map. This allows you to load the result again into the graphical user interface at a later time.
Non-interactive profiling with MAP
It is also possible to run map non-interactively by passing the -profile flag, e.g.
map -profile -n <numprocs> <executable compiled with -g flag> <arguments>
For instance, this could be used in a job when it is launched with a jobscript like
#!/bin/bash
#SBATCH --nodes=1
#SBATCH --ntasks-per-node=40
#SBATCH --time=1:00:00
#SBATCH --job-name=mpi_job
#SBATCH --output=mpi_output_%j.txt
#SBATCH --mail-type=FAIL

module load intel/2018.2
module load openmpi/3.1.0
module load ddt

map -profile -n $SLURM_NTASKS ./mpi_example
This will just create the .map file, which you could inspect after the job has finished with
map MAPFILE
Parallel Debugging and Profiling in an Interactive Session on Niagara
By requesting a job from the 'debug' partition on Niagara, you can have access to at most 4 nodes, i.e., a total of 160 physical cores (or 320 virtual cores, using hyper-threading), for your exclusive, interactive use. Starting from a Niagara login node, you would request a debug sessions with the following command:
debugjob <numberofnodes>
where <numberofnodes> is 1, 2, 3, or 4. The sessions will last 60, 45, 30, or 15 minutes, depending on the number of nodes requested.
This command will get you a prompt on a compute node (or on the 'head' node if you've asked for more than one node). Reload any modules that your application needs (e.g. module load intel openmpi), as well as the ddt module.
Note that on compute nodes, $HOME is read-only, so unless your code is on $SCRATCH, you cannot recompile it (with '-g') in the debug session; this should have been done on a login node.
If the time restrictions of these debugjobs is too great, you need to request nodes from the regular queue. In that case, you want to make sure that you get X11 graphics forwarded properly.
Within this debugjob session, you can then use the ddt and map commands.
Setting up a client-server connection
If you're working from home, or any other location where there isn't a fast internet connection, it is likely to be advantageous to run DDT or MAP in client-server mode. This keeps the bulk of the computation on Niagara or Mist (the server), while sending only the minimum amount of information over the internet to your locally-running version of DDT (the client).
Setting up the server side
The first step is to connect to Niagara (or Mist), and start a debug session
  ejspence@nia-login01 $ debugjob -N 1
  debugjob: Requesting 1 node(s) with 40 core(s) for 60 minutes and 0 seconds
  SALLOC: Granted job allocation 3995470
  SALLOC: Waiting for resource configuration
  SALLOC: Nodes nia0003 are ready for job
  ejspence@nia0003 $
This will start an interactive debug session, on a single node, for an hour. Be sure to note the node which you have been allocated (nia003 in this case).
The next step is to determine the path to DDT. To do this you will need load the DDT module:
 ejspence@nia0003 $ module load NiaEnv/2019b
 ejspence@nia0003 $ module load ddt/19.1
 ejspence@nia0003 $
 ejspence@nia0003 $ echo $SCINET_DDT_ROOT
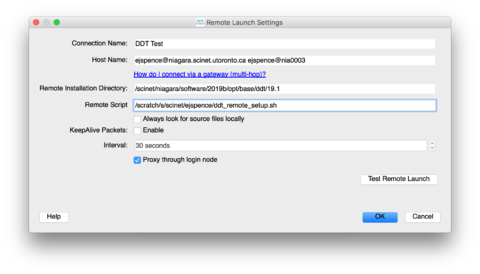
 /scinet/niagara/software/2019b/opt/base/ddt/19.1
 ejspence@nia0003 $
The next step is to create a startup script which will be run by the server, in case you are running on multiple nodes:
 #!/bin/bash
 module purge
 module load NiaEnv/2019b
 module load gcc/8.3.0 openmpi/4.0.1 ddt/19.1
 export ARM_TOOLS_CONFIG_DIR=${SCRATCH}/.arm
 mkdir -p ${ARM_TOOLS_CONFIG_DIR}
 export OMPI_MCA_pml=ob1
Be sure to load whatever modules your code needs to run. Let us assume that the PATH to this script is $SCRATCH/ddt_remote_setup.sh.
This completes the setup of the server side. There is no need to launch the server, the client itself will do this.
Setting up the client side
You now need to setup the client on your local machine (desktop or laptop). The first step is to go to this page to download the Arm Forge client. Note that this page is for older versions of DDT. This is because the client and the server must be running the same version of DDT, and the version on Niagara is 19.1. Download the version of the client appropriate for your local machine, and install it.
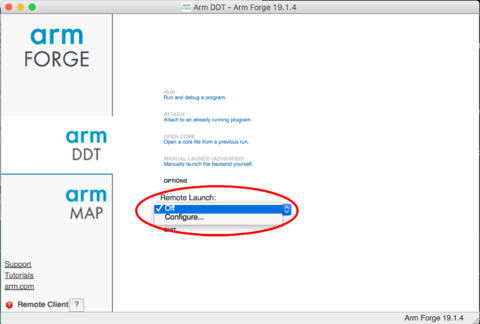
Now launch Arm Forge. You will see a screen similar to this:

|
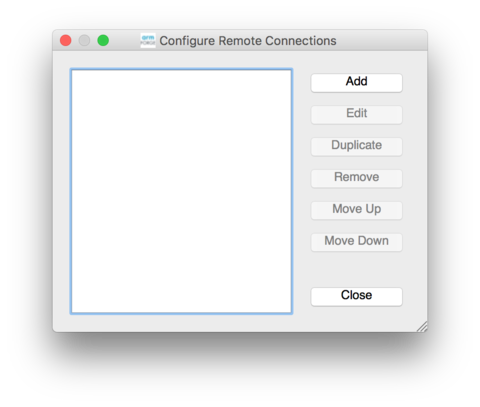
Select "Remote Launch", "Configure".

|

|